Oct 11, 2026
Last Updated: October 10, 2026
Optimising profit margins on non-alcoholic drinks is one of the smartest moves a bar or restaurant can make. Our Non Alcoholic Drinks range is specifically curated to help venues maximise both variety and profitability.
The real opportunity lies in perceived value. A well-crafted mocktail or premium soft drink can command a good price, and the ingredient cost is often low. That can lead to strong gross margins before labour costs. Compare that to many alcoholic drinks, which face tax and regulatory costs that compress margins significantly.
What most bars miss is that customers don't view non-alcoholic drinks as "lesser." They see them as intentional choices. A designated driver ordering a premium mocktail isn't settling for second best, they're making an active purchasing decision. That mindset shift changes everything about pricing and positioning.
Pricing non-alcoholic drinks for maximum returns requires moving beyond guesswork. Two proven methods dominate the market: cost-plus pricing and perceived value pricing. Each works in different scenarios, and many successful venues use both depending on the drink type.
Cost-plus pricing starts with your actual costs and adds a fixed markup percentage. It's transparent and straightforward.
Here's how it works:
Example: A premium mocktail with fresh mint, lime juice, elderflower cordial, and craft tonic has an ingredient cost. Adding labour, you get a total cost. Applying a target margin will lead to a final price.
The advantage is simplicity. You know exactly what you need to sell to break even. The disadvantage is that it ignores what customers will actually pay.
Perceived value pricing ignores your costs entirely. Instead, you price based on what customers believe the drink is worth. This is where the real profit happens.
A premium mocktail presented beautifully with craft garnish, served in a quality glass, and described as "elderflower and gin-free tonic with hand-pressed lime" can command £7.50 even if the ingredient cost is identical to a £4.95 version. The customer perceives greater value based on presentation, naming, and context.
The method:
Most venues find that premium non-alcoholic drinks sell well. Volume rarely drops significantly in a certain range, but price sensitivity can increase sharply at higher prices.
Pricing Method | Best For | Pros | Cons |
|---|---|---|---|
Cost-plus | High-volume, consistent drinks | Transparent, predictable margins | Ignores market demand |
Perceived value | Premium, signature drinks | Maximises revenue per drink | Requires testing and adjustment |
Hybrid | Mixed menus | Balances consistency and profit | More complex to manage |
A bar drink costing template removes guesswork from margin calculation. It forces you to account for every ingredient, portion size, labour element, and waste factor. Without one, you're flying blind on true profitability.
Your template should track:
Let's build a complete costing for a signature seasonal drink:
Ingredients:
Total ingredient cost
Labour allocation: A premium mocktail requires 90 seconds of bartender time (measuring, pouring, garnishing, presentation). At £15 per hour fully loaded (wages, NI, pension), that's £0.23 per drink.
Waste factor: Fresh citrus yields vary by ripeness and cutting technique. Build a 12% waste factor into your costing to reflect spoilage and over-portioning. This adds £0.14 to your true cost (12% of £1.20 + £0.23).
True total cost
Target margin: For a signature drink, aim for 65-70% gross margin. Using 65%:
But this assumes no other overhead. If you add venue overhead, the true cost and selling price will adjust.
If you price at a certain point, you can calculate the contribution margin and net margin.
Use a simple spreadsheet with columns for:
Update this monthly. Ingredient costs change seasonally. New suppliers might offer better pricing. A template that's three months old is giving you stale data.
Gross margin (revenue minus ingredient cost) is useful for quick checks. But contribution margin (revenue minus all variable costs, including labour and waste) tells you how much each drink contributes to fixed costs (rent, insurance, equipment depreciation) and profit.
If your gross margin is strong but labour and waste eat into it, your true contribution margin will be lower. That's the number that matters for profitability.
Many venues discover they're pricing too low only when they calculate contribution margin properly. A drink that looks profitable at 75% gross margin might be barely breaking even after labour.
Once you've costed your drinks, track actual costs weekly:
Compare actual to budgeted. If actual ingredient cost is 5% higher than budgeted, your supplier costs have risen or portion control has drifted. If actual labour cost is 10% higher, your drinks are taking longer to make or staff are over-portioning. If actual waste is 15% instead of 12%, you need better storage or training.
This discipline is what separates venues with strong, sustainable margins from those that drift into unprofitability. When you're ready to streamline your ordering and ensure consistent stock of quality non-alcoholic drinks, Trade ordering through Swallow makes it simple to manage your supplier relationships and maintain the margins you've calculated.
Your menu architecture determines whether non-alcoholic drinks become a profit driver or an afterthought. The best menus feature three tiers: signature mocktails, premium soft drinks, and classic non-alcoholic options.
Signature mocktails are your margin heroes. They command premium pricing because they require skill, fresh ingredients, and presentation. A well-designed signature mocktail menu includes 4-6 options that rotate seasonally.
Build them around:
Craft sodas are a growing category. They position your venue as quality-focused and justify premium pricing. Many independent venues stock 2-3 craft sodas alongside standard options. The margin on a craft soda often exceeds many alcoholic drinks. Swallow's Non Alcoholic Drinks range includes premium options that help you build a menu that stands out.
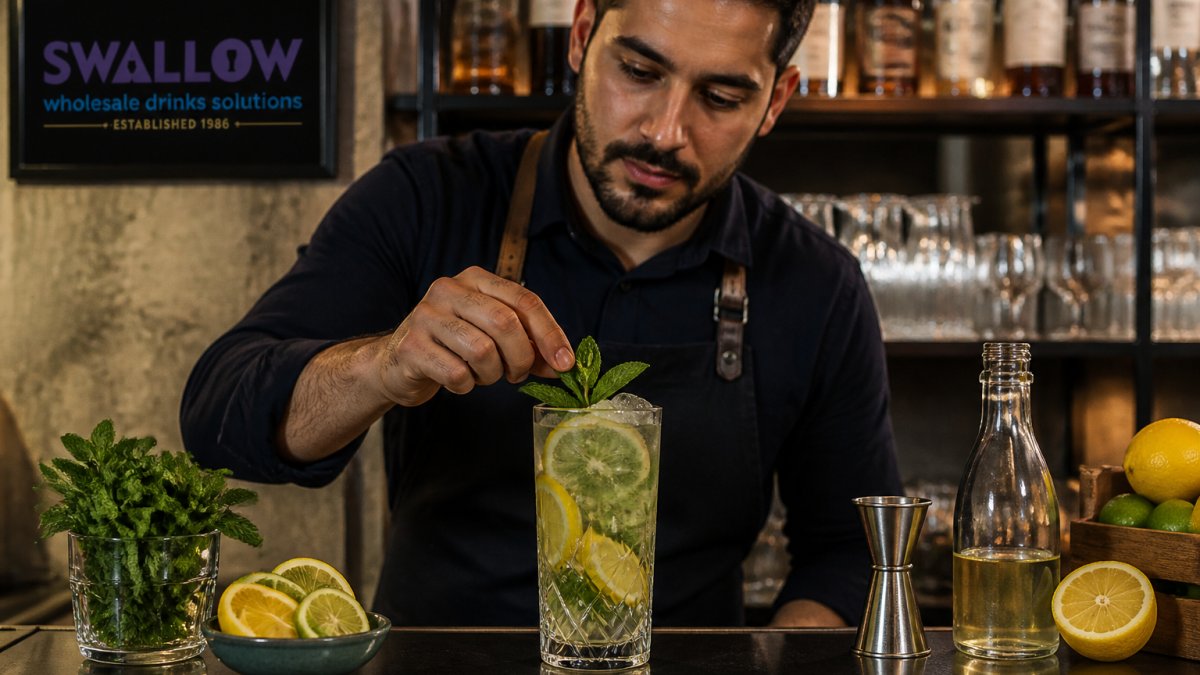
Seasonality drives both cost efficiency and customer interest. Winter drinks feature spiced syrups and warming spices. Summer drinks highlight fresh berries and citrus. This approach:
A winter spiced mocktail featuring cinnamon, clove, and vanilla costs less in December than July. A summer berry mojito-style drink costs less in July than December. By rotating, you maintain margin consistency while appearing fresh.
Local ingredients also resonate with customers. Sourcing from local producers creates a story you can tell on your menu. "Elderflower cordial from [Local Producer]" beats generic descriptions.
Waste directly reduces margin. A 10% waste rate on fresh citrus, syrups, and cordials can cut your margin by 10-15 percentage points. Controlling waste is margin protection.
Common waste sources:
Practical controls:
Many venues find that a single staff member focused on portion consistency can recover margin within a month. That's significant on a busy bar.
You cannot optimise what you don't measure. Venues that implement a disciplined measurement system can outperform those that guess in margin. The key is choosing the right metrics, measuring them consistently, and acting on what the data reveals.
1. Average selling price per non-alcoholic drink
2. Gross margin percentage
3. Contribution margin percentage
4. Waste percentage
5. Labour cost per drink
6. Stock turnover rate
Create a one-page monthly dashboard in a spreadsheet or bar management system with these six metrics. Track them for 12 months. You'll quickly see seasonal patterns, spot cost creep, and identify which menu items are genuinely profitable.
Example dashboard structure:
Metric | Jan | Feb | Mar | Apr | May | Jun | Target | Status |
|---|---|---|---|---|---|---|---|---|
Avg selling price | £6.20 | £6.15 | £6.18 | £6.25 | £6.30 | £6.28 | £6.20+ | ✓ |
Gross margin % | 76% | 74% | 75% | 76% | 77% | 76% | 70%+ | ✓ |
Contribution margin % | 58% | 56% | 57% | 59% | 60% | 59% | 50%+ | ✓ |
Waste % | 3.2% | 4.1% | 3.8% | 3.5% | 2.9% | 3.1% | <5% | ✓ |
Labour cost/drink | £0.22 | £0.24 | £0.23 | £0.21 | £0.20 | £0.21 | £0.25 | ✓ |
Stock turnover | 9.2x | 8.8x | 9.1x | 9.5x | 10.2x | 9.8x | 8x+ | ✓ |
Update this monthly. When a metric drifts outside target, investigate immediately. A drop in contribution margin can lead to lost profit.
Measurement without action is pointless. Here's how to respond to common signals:
If average selling price drops: You're either selling more low-margin items or staff are undercharging. Review your menu mix and retrain staff on pricing.
If gross margin drops: Ingredient costs have risen or portion control has drifted. Check supplier invoices and retrain staff on portions.
If contribution margin drops but gross margin is stable: Labour costs are rising. Either drinks are taking longer to make (process issue) or you're overstaffed during quiet periods.
If waste rises: Storage conditions need review, staff training on portion control is needed, or you're over-ordering perishables.
If labour cost per drink rises: Drinks are becoming more complex, or staff efficiency has dropped. Simplify recipes or improve training.
If stock turnover slows: You're over-ordering or demand has dropped. Reduce order quantities and review menu performance.
The venues that thrive are those that measure, identify problems early, and fix them quickly.
Non-alcoholic drinks typically generate strong gross margins, significantly higher than alcoholic drinks. The exact margin depends on your input costs, pricing strategy, and whether you're serving simple soft drinks or premium craft mocktails. Using a bar drink costing template helps you calculate your actual margins based on ingredient costs, preparation time, and glassware. Premium positioned alcohol-free options can command higher selling prices and improve your overall margin performance.
Price non-alcoholic drinks using cost-plus methodology: calculate total input costs (ingredients, garnish, glassware) and apply a markup to set your selling price. This accounts for waste, labour, and overhead. Alternatively, use perceived value pricing: premium mocktails with craft presentation can command higher prices, while simple soft drinks will have a lower price point. Test price sensitivity with your customers and monitor sales mix to identify which drinks drive the highest revenue. Swallow Drinks' trade ordering platform helps you track supplier costs accurately for precise calculations.
Premium mocktails, craft sodas, and alcohol-free spirits generate the strongest margins when positioned as premium offerings. Branded soft drinks like Pepsi offer consistent margins but lower perceived value. Seasonal and local ingredients create differentiation and justify higher prices. Consider your venue type: high-volume nightclubs benefit from simple, fast-to-prepare options, whilst gastropubs can command premium prices for craft presentations. Use sales mix analysis to identify which drinks your customers prefer, then optimise your menu around the highest-margin performers.
Waste directly cuts into your profit margins on non-alcoholic drinks. Track spillage, over-pouring, and spoilage through daily stock checks. Use bag-in-box syrups like [BIB SWALLOW PEPSI MAX 12LTR - PINK CONNECTOR](https://www.swallow.uk.com/products.php?prd=soft-drinks&sprd=bag-in-box-syrup&pid=bib-swallow-pepsi-max-12ltr-pink-connector#productcats) to reduce waste compared to bottled options. Implement portion control with standard measures and train staff on consistent preparation. Monitor perishable ingredients closely and rotate stock using FIFO (first in, first out). Calculate your waste as a percentage of revenue monthly and set reduction targets. Even a small reduction in waste significantly improves your bottom line across your entire non-alcoholic drinks programme.
Members of:


AWRS Registration Number: XJAW00000100730