Oct 08, 2026
Last Updated: October 8, 2026
Getting drinks sales forecasting right for a major sporting event can be the difference between a packed, profitable matchday and a cellar full of stock nobody ordered.
The stakes are higher than most people think. A single big match can pull in several times your normal footfall in one afternoon.
Below, we break down a forecasting framework you can run before every tournament, plus the operational decisions that follow from it.
UK Hospitality industry guidance
Drinks sales forecasting is the process of estimating how much of each product you will sell during a set period, using past sales, event context and external factors. A good forecast is specific: it names the product, the volume and the time window. A bad one is a feeling.
Here is the five-step method we recommend to venues across the West Midlands, with a worked example so you can see how the numbers move.
Start with the window. A knockout fixture might drive trade from early afternoon through to last orders, so forecast by hour, not by day. Then split your product mix into three groups: core lager and beer, soft drinks, and low and non-alcoholic options.
For a typical matchday, that might look like:
Pull the same fixture or a similar event from last year. Look at what you actually sold, not what you ordered. This gives you a baseline to adjust from rather than a blank page.
Then layer on the variables: kick-off time, whether it is a knockout game, and the forecast. A warm Saturday afternoon shifts the mix towards lager and soft drinks. A cold, wet one pushes it towards spirits and hot drinks.
This is the step most guides skip. Take a baseline and apply multipliers you can defend from your own records.
Say a mid-table league fixture on a mild Saturday gives you a baseline of 600 pints of lager and 180 pints of soft drinks. For a knockout fixture with a 5pm kick-off and a warm, dry forecast, a common pattern is:
Applied in sequence to the lager line: 600 × 1.40 = 840; 840 × 1.15 = 966; 966 × 1.20 = 1,159 pints. Round to 1,160 pints and convert to kegs using your own yield per keg.
Do the same for soft drinks: 180 × 1.25 = 225; 225 × 1.15 = 259; 259 × 1.30 = 337 pints. That is the number your order and your par levels are built from, not a guess.
Order roughly 80% of the forecast as your core delivery, timed to land two days before the event. Hold the remaining 20% as a top-up you can call off on the morning of the match once you have a final read on the weather and any late team news. This keeps cash free and still protects you against a stockout.
If you would rather not build the multipliers from scratch, our trade team can help you set them against your own till data. Register at our trade portal to see pricing and place orders, or browse our keg lager range and our low and non-alcoholic options to build a matchday mix that suits your venue.
Using historical sales data to forecast demand is the single most reliable input you have. Your own till data beats any generic industry average, because it reflects your menu, your prices and your regulars.
The trick is knowing which history to trust. A one-off cup final is not the same as a mid-table league game.
A common mistake is treating last year's total as gospel. If your venue has changed its menu, added a draught line or shifted its pricing, the old number needs adjusting before it means anything.
Office for National Statistics retail sales data
Weather impact on pub drinks sales is bigger than most operators allow for. A warm, dry afternoon can lift lager and soft drink sales sharply, while a cold snap shifts demand towards spirits and stouts.
The practical approach is to build two versions of your forecast: a warm-weather plan and a cold-weather plan. Then check the forecast 48 hours out and commit.
| Condition | Lager & Beer | Soft Drinks | Spirits & Stout |
|---|---|---|---|
| Warm and dry | High | High | Lower |
| Mild | Steady | Steady | Steady |
| Cold and wet | Lower | Lower | Higher |
That table is a starting point, not a rule. Track your own numbers against the weather for a season and you will have a far sharper picture than any generic guide can give you.
Pub stock planning for sporting events comes down to one question: what do you need on site, and when? Get the timing wrong and you are either short on Saturday or sitting on kegs for a month.
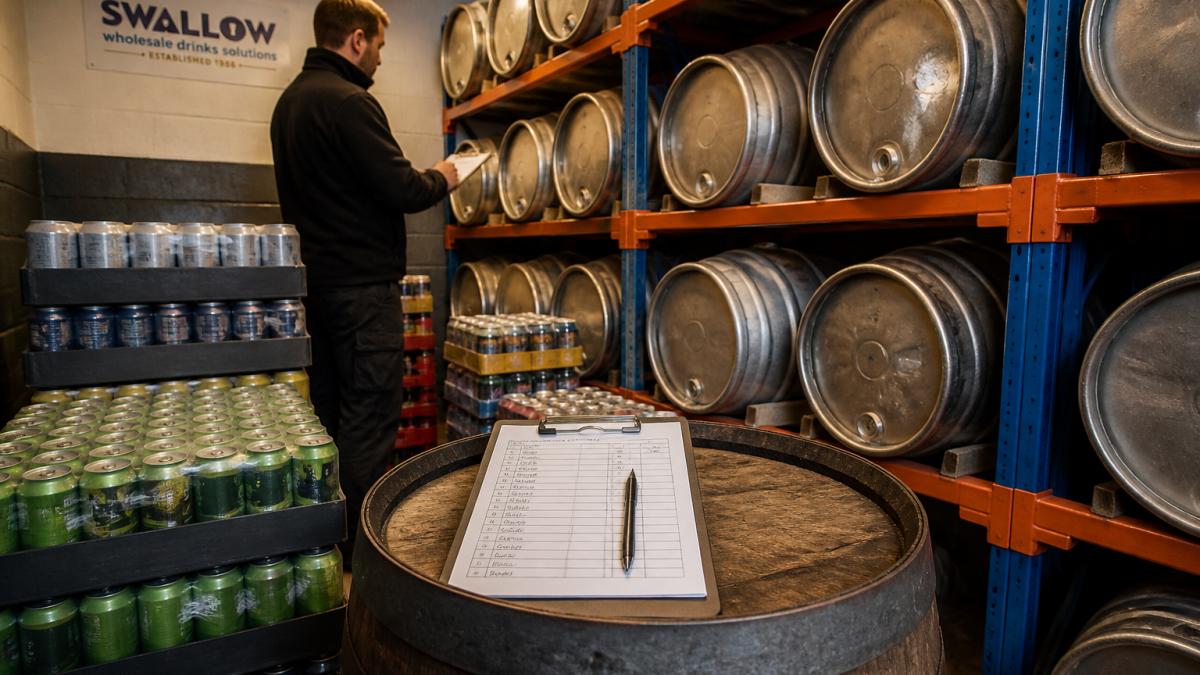
Build your order around the forecast, then add a buffer for the lines that sell fastest. Keep the buffer tight on slow movers and generous on your top lager and soft drinks.
A reliable supplier matters here. You can browse our keg lager range or our low and non-alcoholic options to build a matchday mix that suits your venue.
Manual forecasting, where you estimate from memory and gut feel, is fast but drifts. Data-driven forecasting, where you build from till records and event context, takes longer but holds up under pressure.
| Method | Speed | Accuracy | Best For |
|---|---|---|---|
| Gut feel | Very fast | Low | Tiny venues, one-off events |
| Last year's total | Fast | Medium | Repeat fixtures |
| Baseline plus adjustments | Moderate | High | Most pubs and bars |
| Hourly data model | Slow | Highest | High-volume venues |
Most independent venues do not need a full data model. A baseline plus event and weather adjustments will get you most of the way there. But whichever method you use, the forecast is only as good as your ability to measure it, and this is where most operators stop short.
The simplest useful metric is percentage error: predicted sales minus actual sales, divided by actual sales, expressed as a percentage. If you predicted 1,160 pints of lager and sold 1,020, your error is (1,160 − 1,020) ÷ 1,020 = +13.7%, meaning you over-forecast by roughly 14%.
Track that number event by event. A common pattern is that error falls sharply over the first three or four events as your multipliers bed in, then plateaus. If it is not falling, your baseline or your multipliers are wrong, not your luck.
Forecast error tells you whether the number was right. These tell you whether the number was useful:
Before you switch methods, run the new one against last season's events on paper. Take the fixtures you already have actual sales for, apply the new multipliers, and compare the results to what you sold. If the new method would have been further out than your current one on the majority of events, it is not an upgrade.
After each event, adjust one or two multipliers rather than starting again. If you consistently over-forecast warm-weather lager by around 10%, trim that multiplier. Small, evidence-based adjustments compound into a forecast that is genuinely yours, and that is what beats a generic industry average every time.
A forecast is only useful if it changes what you do. Turn the numbers into decisions on stock, staff and promotions before the event, not during it.
If you want a partner who understands your menu rather than just taking orders, our trade team can help you build the right product mix. Register at our trade portal to see pricing and place orders.
Kick-off time, day of the week, expected crowd size, weather, and the teams playing all shift demand. Evening matches drive longer drinking sessions, while early kick-offs favour soft drinks and non-alcoholic options. A single event can lift drink sales significantly above a normal trading day, so building a forecast around these variables helps you order the right quantities.
Start with your historical sales data from similar fixtures, then adjust for kick-off time, expected attendance, and weather. A practical method is to take your average match-day sales, apply a percentage uplift for bigger events, and add a buffer for popular lines like lager and soft drinks. Reviewing your forecast 48 hours before the event lets you fine-tune your order with your supplier.
Lager, canned soft drinks, and non-alcoholic beer consistently perform well. Products like Madri Lager and Diet Coke Cans are reliable match-day staples, while Guinness 0% NA Cans and Lucozade Sport Orange cater to fans choosing low-alcohol or soft options. Stocking a mix across beer, soft drinks, and non-alcoholic lines reduces the risk of stockouts in any single category.
Warm weather typically increases sales of lager and soft drinks, while cold or wet conditions push demand toward spirits and hot drinks. Evening kick-offs tend to extend drinking sessions, whereas early kick-offs favour shorter visits with more soft drink purchases. Factoring both into your forecast helps you avoid over-ordering one category and running short on another.
Matchday demand is unpredictable, but your stock planning does not have to be. Swallow Drinks has spent over 40 years helping independent pubs, bars and venues across Birmingham get their drinks mix right, with a vast portfolio of premium brands, six-day-a-week delivery and a trade team that knows the on-trade. Get started with Swallow Drinks and turn your next big fixture into your best trading day of the season.
Members of:


AWRS Registration Number: XJAW00000100730