Aug 06, 2026
Last Updated: August 6, 2026
Getting your drink stock right is harder than it looks. Many bar and restaurant operators find themselves caught between overstock that ties up cash and drives wastage, or stockouts that frustrate customers on busy nights. The cost of getting it wrong compounds quickly across a hospitality operation.
At Swallow Drinks, we've worked with independent venues across Birmingham and the West Midlands for over 40 years, and we've seen firsthand how accurate demand forecasting transforms operations. When you forecast drink demand accurately, you reduce waste, improve cash flow, and ensure you're never caught short when customers arrive. A pub that miscalculates demand by just 10-15% across its range can waste hundreds of pounds monthly in spoilage, particularly with perishable items like draught beer and cider. Conversely, a stockout during a busy Friday night doesn't just lose that one sale, it damages reputation and sends customers to competitors. Accurate forecasting bridges that gap, turning historical data and market insight into a working system that actually reflects how your venue operates.
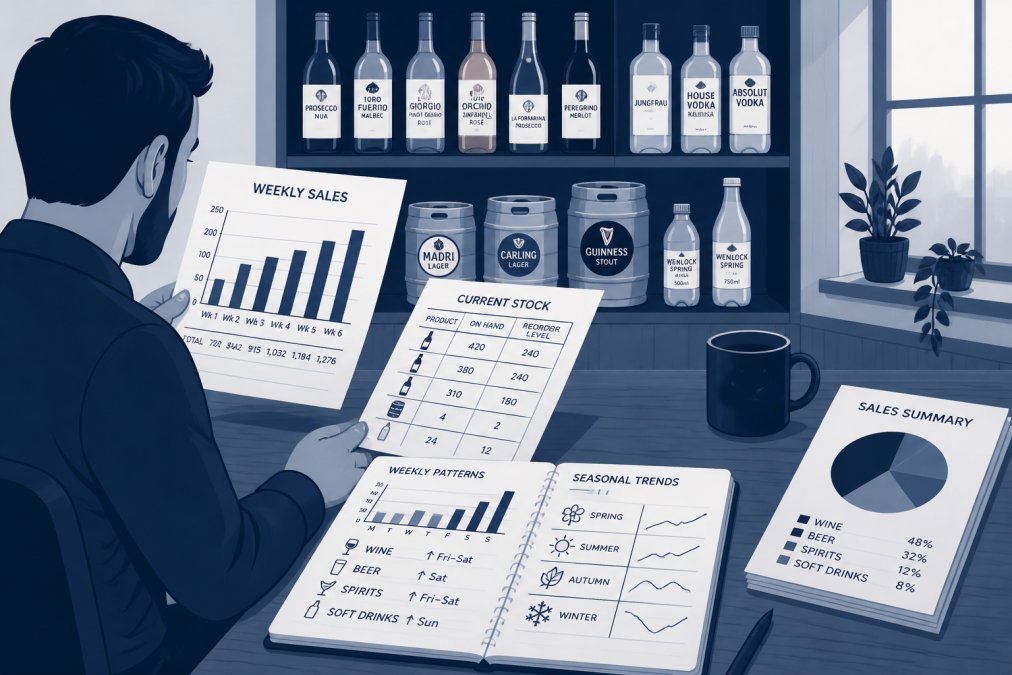
The foundation of any reliable forecast is historical sales data. Start by collecting point-of-sale records for at least the past 12 months. This data should show what you sold, when you sold it, and ideally at what price point. Most modern tills capture this automatically; older systems may require manual reconciliation with delivery notes and stock counts.
Once you have the raw data, segment it by category: draught lagers, ciders, spirits, soft drinks, wines, and any other major groupings relevant to your operation. This segmentation matters because demand patterns differ dramatically across categories. A Friday night might see draught beer sales spike 40% above the weekly average, whilst bottled wine may hold steady.
Look for trends within that 12-month window. Did sales grow month-on-month? Did particular months show seasonal spikes, December for festive entertaining, August for summer garden events? Did a menu change or promotion create a visible bump in sales? Pay particular attention to outliers: unusually high or low weeks. Understanding what caused these variations helps you avoid treating them as normal baseline demand.

Seasonal fluctuations are the single biggest driver of forecasting error for venues that ignore them. Winter months typically see increased demand for warming drinks: spirits, hot drinks, and heavier ales. A gastropub in the West Midlands might see whisky and rum sales climb 25-35% in November and December compared to summer months. Spring brings a shift toward lighter lagers and soft drinks as temperatures rise.
Summer is peak season for most hospitality venues. Garden seating drives volume, holidays increase footfall, and customers tend toward refreshing options. Expect demand to spike across the board, but particularly for draught lagers, ciders, and soft drinks. Autumn presents a transition period with back-to-school timing, the start of the football season, and the approach of Halloween and Bonfire Night all influencing purchasing.
Beyond weather and season, consider local events and cultural patterns specific to your area. A venue near a football stadium will see demand spikes on match days. A city-centre bar experiences different seasonal patterns than a rural country pub.
The practical approach is to overlay your historical sales data against a seasonal calendar. For each month, calculate the average sales across that month for the past three years and express it as a percentage of the annual average. This gives you a seasonal index: a multiplier you apply to your baseline forecast to account for known seasonal variation. A month that typically runs 15% above average gets a 1.15 multiplier; a month that runs 10% below average gets a 0.90 multiplier.
Demand planning in hospitality requires a structured approach involving three elements: baseline demand, seasonal adjustment, and tactical adjustment.
Start with baseline demand by calculating the average weekly sales for each product category across a normal operating period, typically excluding the highest and lowest weeks to avoid skew. Apply seasonal adjustment next using the seasonal index you developed previously. If you're forecasting for November and your seasonal index is 1.12, multiply your baseline demand by 1.12.
Tactical adjustment comes last, accounting for factors that aren't purely seasonal: a planned promotion, a new menu item, a known local event, or staffing changes. If you're planning a summer cocktail promotion, you might increase your spirits forecast by 20% for those weeks. Document your assumptions to create accountability and help you learn what actually drives demand in your venue.
Review forecasts weekly. Every week, compare your forecast to actual sales. Where you missed, investigate why. Did a local event you didn't anticipate drive higher demand? Did customer preferences shift? These weekly reviews are how you build intuition and improve accuracy.
For venues serious about demand planning, drink stock management software transforms the process from manual spreadsheets to real-time visibility and automated alerts.
Good stock management software tracks what you have on hand in real time, records what you sell, and compares actual sales against your forecast. The best systems integrate with your till, so sales data flows automatically rather than requiring manual entry. They also integrate with your supplier ordering, so you can see lead times and plan accordingly.
Real-time data visibility means you can spot problems before they become crises. If a particular drink is selling faster than forecast, you see it immediately and can reorder before you stockout. If something is selling slower, you can adjust your forecast and avoid overstock.
Many venues use spreadsheets because they're familiar, but they're labour-intensive and error-prone. A dedicated stock management system removes the manual work and adds layers of insight that spreadsheets can't match. When evaluating software, look for systems that support your specific needs: multiple suppliers with different lead times, multiple venues if you operate them, and interfaces that don't require a dedicated stock controller to run.
Wastage is the silent drain on most hospitality venues. For a venue turning over £3,000 per week in drinks sales, a 2% wastage rate costs £60 per week, or £3,120 per year. Better forecasting cuts that directly.
Wastage comes from overstock leading to spoilage, particularly with perishable items like draught beer that loses condition after a few weeks, or ciders that oxidise. Expired stock that reaches its use-by date before it sells also contributes significantly.
Accurate forecasting addresses these directly. When you forecast correctly, you order only what you'll sell within the product's shelf life. Know the shelf life of every product you stock: draught beer kegs typically hold quality for 6-8 weeks once tapped; bottled beers last longer; wines have variable shelf life depending on style; spirits essentially don't spoil.
Use FIFO stock rotation, First In, First Out. Newer stock goes to the back; older stock is used first. Match your order quantities to your forecast and shelf life. If a product has an 8-week shelf life and you forecast selling 2 kegs per week, you can safely stock 15 kegs. Monitor your actual wastage by weighing or counting what you throw away, recorded by category. This data shows you where the problem actually is.
Work with your supplier on flexibility. If you're forecasting demand accurately, you can order more frequently in smaller quantities, reducing the risk that stock will age. Swallow Drinks offers reliable six-day-a-week delivery, making this possible. Infrequent large deliveries force you to hold more stock to cover the gaps, which increases wastage risk.
The first mistake is treating all products the same. A high-volume draught lager and a slow-moving premium spirit require different forecasting approaches. Segment your product range and apply appropriate rigour to each segment.
The second mistake is ignoring external factors. If a new competitor opens nearby, a local event is cancelled, or a menu change happens, your forecast becomes instantly obsolete. Explicitly account for known changes and adjust the forecast accordingly.
Third is forecasting too far ahead with too much confidence. Your 12-week forecast will be less accurate than your 4-week forecast. Order more frequently in smaller quantities rather than trying to predict demand months in advance.
Fourth is setting a forecast and never revisiting it. Every week, compare forecast to actual. Where you missed, understand why and use that learning to refine next week's forecast.
Fifth is over-relying on averages. If your average weekly lager sales are 10 kegs but actual weekly sales range from 6 to 14, using 10 as your forecast will leave you short half the time. Understanding the range and variability is as important as understanding the average.
Sixth is failing to account for lead time. If your supplier needs three days to deliver, you cannot forecast demand for tomorrow. You must forecast for three days ahead.
Forecasting drink demand accurately is learnable. It requires discipline, gathering historical data, understanding seasonal patterns, documenting assumptions, and reviewing actual results weekly, but it's not complex. The venues that master this process operate with fewer stockouts, less wastage, and better cash flow.
Swallow Drinks has supported independent hospitality venues across Birmingham and the West Midlands for over 40 years, and we understand the operational realities you face. Our reliable six-day-a-week delivery and diverse portfolio of premium wines, beers, spirits, and soft drinks give you the flexibility to order in smaller, more frequent quantities, which means you can forecast with higher confidence and lower risk of overstock.
If you're ready to move from guesswork to data-driven ordering, explore our trade ordering platform at webtrade.swallow.uk.com where you can access real-time stock, place orders, and integrate with your demand planning. Get in touch with Swallow Drinks today and discover how accurate demand forecasting transforms your operation.
Measure forecast accuracy by comparing predicted demand against actual sales. Calculate the Mean Absolute Percentage Error (MAPE) by taking the average of absolute differences between forecast and actual figures, divided by actual demand. A MAPE below 10% is considered excellent for drinks forecasting. Track this weekly to identify which products your forecasting method handles best, then refine your approach for weaker categories.
Demand varies by day of week, season, weather, local events, and customer demographics. Friday and Saturday nights typically see 40-60% higher sales than weekday evenings. Summer months boost soft drink and cider sales; winter increases spirit and hot drink consumption. Bank holidays, sporting events, and school holidays create predictable spikes. Understanding these patterns helps you forecast drink demand accurately and avoid both stockouts and excess stock.
Seasonal fluctuations significantly impact what your customers order. During summer, lager and cider sales rise sharply; winter sees increased demand for spirits and warming drinks. Spring bank holidays and Christmas create concentrated peaks. By tracking seasonal patterns in your historical sales data, you can build seasonal adjustments into your forecasts. This prevents overstocking slow-moving lines and ensures you have enough of high-demand products when peaks arrive.
Combine three approaches: analyse your historical sales patterns by product and day of week, adjust for known seasonal trends and upcoming events, and monitor real-time sales data weekly to catch unexpected shifts. Start simple with a spreadsheet tracking weekly sales by category, then graduate to drink stock management software as your venue grows. Review and update forecasts every two weeks to stay responsive to changing customer behaviour and market conditions.
Members of:


AWRS Registration Number: XJAW00000100730