Aug 18, 2026
Last Updated: August 18, 2026
Many bar managers stock based on habit, supplier recommendations, or guesswork. They never examine the data. Understanding which drinks drive profit, which sit gathering dust, and where stock bleeds money through waste is critical to success.
At Swallow Drinks, we've worked with independent bar operators across the region for over 40 years, and the pattern is consistent: venues that track menu performance systematically outperform those that don't. They know their contribution margins, spot slow movers before expiry, and adjust their mix based on real data.
A single poorly performing spirit or wine taking up valuable shelf space could represent hundreds of pounds in lost opportunity each month. Identifying your top performers and ensuring consistent stock can lift revenue without adding complexity. This guide walks you through the exact steps to analyze bar menu performance like a data-driven operator.
You cannot analyze what you don't measure. The foundation of everything that follows is having clean, accurate data about what you're selling, what it costs, and what's moving.
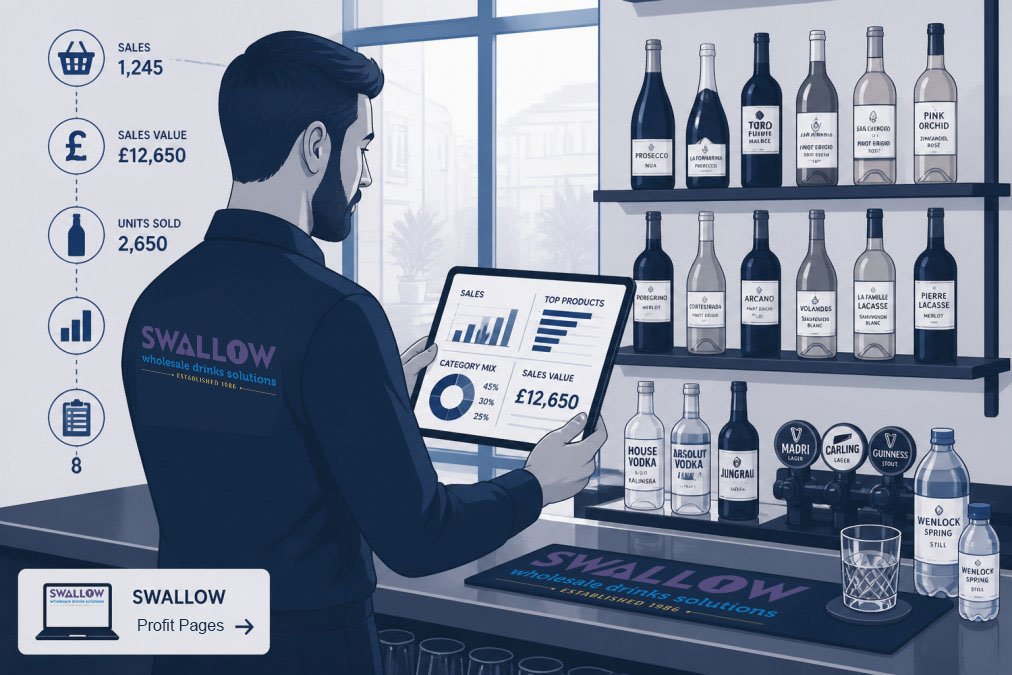
Your point-of-sale system is your primary source of truth. Every drink sold should be logged with its name, quantity, price, and timestamp. Pull reports showing sales by drink, by category (spirits, wines, beers, soft drinks), and by time period. Daily is ideal; weekly at minimum. You need to see patterns: which drinks move consistently, which spike on weekends, which haven't sold in weeks.
Real-time reporting from your POS gives you the edge. If you notice a premium spirit hasn't sold in three weeks, you can make a decision before it becomes a dead stock problem. Some POS systems integrate with analytics dashboards; others require manual export. Either way, the effort pays for itself when you catch a problem early.
Knowing what you paid for each drink is essential. Track the unit cost of every spirit, wine, beer, and soft drink you stock. When prices change, update your records.
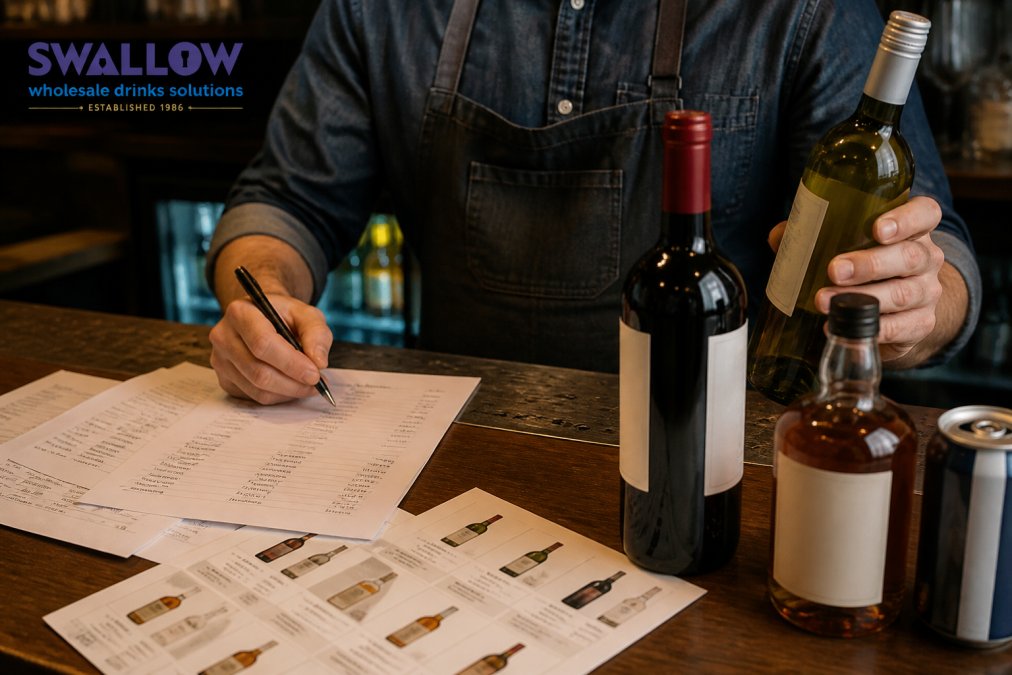
Many independent bars use a simple spreadsheet: drink name, supplier, unit cost, current stock quantity, reorder point. Update it when you receive stock and when you do a physical count. Physical stock counts are non-negotiable. Count your high-value items monthly; lower-value stock quarterly. This catches theft, spillage, and waste that your POS might not capture. The difference between your POS count and your physical count is often where margin leaks happen.
Once you have sales and cost data, you can calculate what each drink actually contributes to your bottom line.
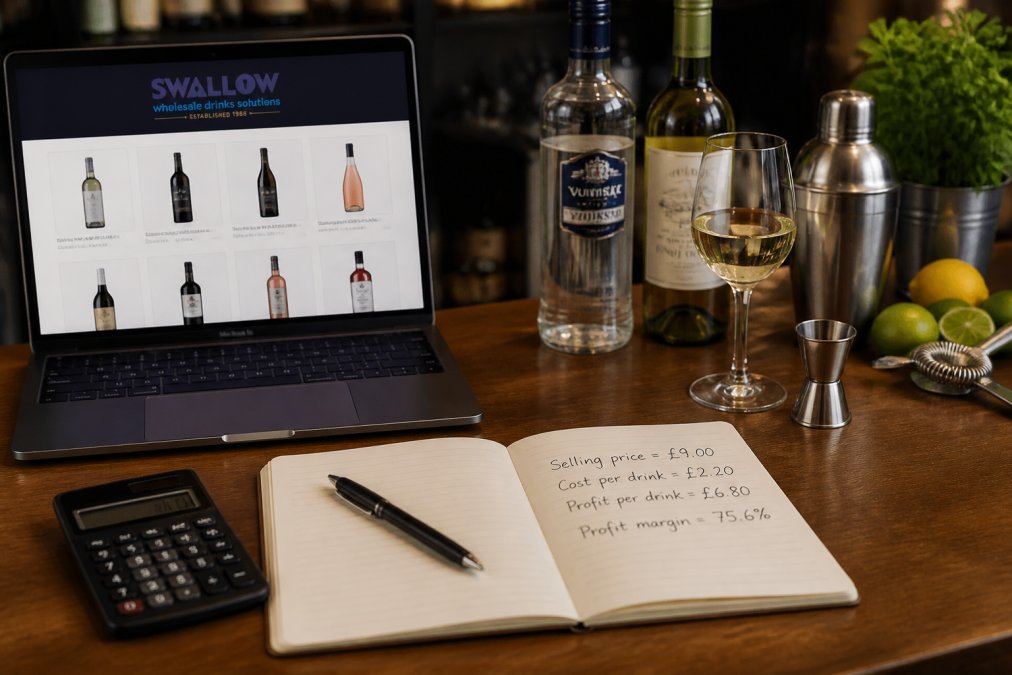
Contribution margin is the amount each drink contributes to covering your fixed costs after you've paid for the drink itself. It's calculated simply: selling price minus cost of goods sold.
Example: A spirit costs you £8 to purchase and you sell it for £24. Your contribution margin is £16 per unit. If you sell 20 of those spirits per week, that drink contributes £320 weekly toward your fixed costs and profit.
Your overall bar cost percentage is total COGS divided by total sales. If you spent £2,000 on stock and made £8,000 in sales, your bar cost percentage is 25%. Industry benchmarks suggest 20-30% is healthy for bars, depending on your mix.
Two drinks with the same selling price can have wildly different contribution margins if one costs significantly more. A £24 cocktail using premium spirit (£8 cost) contributes more than a £24 cocktail using standard spirit (£4 cost). Yet many bars price them identically. When you calculate margins drink by drink, these gaps become obvious.
Menu engineering is the practice of categorizing your offerings based on popularity and profitability, then using that matrix to guide decisions about what to keep, promote, or remove.
Rank your drinks by sales volume over 4-12 weeks. This is your popularity index. Create a simple ranking: your top 20% of drinks by volume are your stars.
Then overlay profitability. Which popular drinks also have the highest contribution margins? These are your champions; promote them, ensure consistent stock, train staff to recommend them. Which drinks are popular but low-margin? Keep them in stock but don't prioritise them.
The real value emerges when you identify drinks that are neither popular nor profitable. A premium wine that hasn't sold in two months? Remove it. A craft spirit with margins so thin it barely covers shelf space? Consider discontinuing it.
The menu engineering matrix is a simple 2x2 grid that categorises drinks into four quadrants:
To build your matrix: plot each drink's sales volume on the horizontal axis and contribution margin on the vertical axis. The median sales volume and median margin become your dividing lines. This exercise often reveals that venues stock 30-40% dogs.
Analysing performance isn't a one-time exercise. You need ongoing visibility into how your stock is moving, where waste is happening, and whether changes are working.
Sales velocity is how quickly a drink sells through your stock. A spirit with high sales velocity moves from shelf to customer in days. One with low velocity sits for weeks.
Calculate velocity simply: units sold per week. High-velocity items let you turn cash quickly; low-velocity items tie up capital.
Real-time reporting from your POS lets you spot velocity problems before they become expensive. Set up a simple dashboard or weekly report showing: each drink's sales this week, average sales per week over the last 12 weeks, current stock quantity, and days of stock on hand. Days of stock on hand is calculated: current quantity divided by average weekly sales. If a spirit averages five units per week and you have 15 bottles, you have three weeks of stock.
Waste and spoilage are silent profit killers. A bottle of wine that expires before you sell it is 100% loss. A spirit that gets spilled or given away as a comp is money gone. Many bars don't track this systematically.
Start measuring: how many bottles do you discard monthly due to expiry, breakage, or spillage? Track this by category and by supplier. If you're regularly throwing away stock, you're buying too much. When you integrate spoilage into your performance analysis, your true cost per drink sold becomes clear.
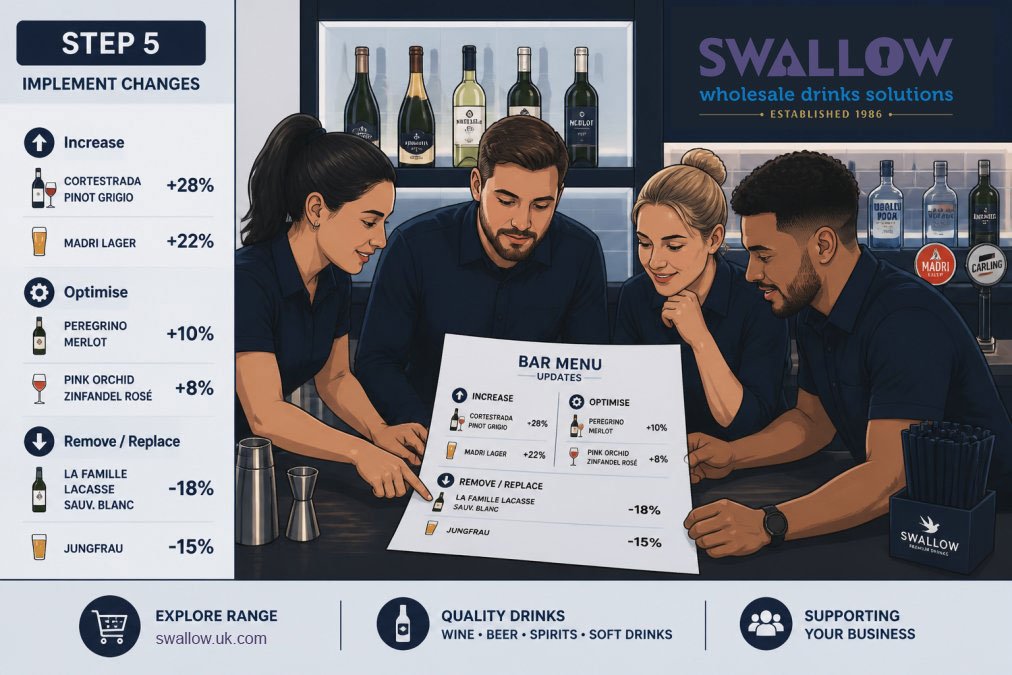
Analysis is worthless if it doesn't lead to action. Once you've identified your stars, puzzles, plow horses, and dogs, you need a process for making changes and measuring impact.
Your bar's performance changes with seasons. Summer customers order different drinks than winter customers. Pull your sales data by season over the last two years. Which drinks spike in summer? Which are winter staples?
Use this pattern to plan your menu rotation. Three months before summer, start building stock of your known summer performers. Reduce stock of winter favourites. This minimises the risk of being caught with the wrong mix when the season shifts.
Your menu analysis is only as good as your staff's ability to sell from it. Train your team on your top performers. Which drinks should they recommend? Why? Create a simple one-page guide: your five star drinks, their key characteristics, and a pitch for each.
Upselling isn't pushy if it's genuine. If a customer orders a standard spirit, offering a premium alternative with a brief description is service. Many customers don't know what you stock. Educating them creates opportunities to move higher-margin products.
Incentivise your team. If they sell 20% more of your top-margin drinks this month, reward them. This aligns their interests with your profitability.
Beyond individual drink analysis, you need a dashboard of metrics that tell you whether your bar is moving in the right direction.
Gross profit margin is your north star. Calculate it monthly: (total sales minus total COGS) divided by total sales. Track this over time. If it's declining, your cost structure is shifting. If it's improving, your changes are working.
Stock turnover ratio measures how many times you sell through your average stock in a period. Calculated: COGS divided by average stock value. A ratio of 8 means you turn your entire stock eight times per year, or roughly weekly. Higher is generally better, but it depends on your category.
Waste percentage is total discarded stock divided by total stock purchased. Track this monthly. A healthy bar runs 2-3% waste; anything above 5% signals a problem.
Days sales of stock tells you how many days of stock you have on hand. Most bars aim for 30-45 days. Below 30 and you risk stockouts; above 60 and you're tying up too much cash.
Average transaction value is total sales divided by number of transactions. If it's declining, your customers are ordering lower-margin items or fewer items per visit.
Manual spreadsheets work, but they're time-consuming and error-prone. Many modern POS systems offer built-in analytics dashboards. If yours does, use them. You can pull reports on sales by drink, by category, by time period, and by staff member without touching a spreadsheet.
For venues using Swallow Drinks as your supplier, our team can discuss how to align your ordering patterns with your performance data. Knowing your sales velocity by drink category helps us ensure you're never caught short on your top performers while avoiding overstock of slower movers. Register with our trade ordering platform to simplify your ordering and access detailed product information that supports your analysis.
Spreadsheet discipline is still valuable even with automation. The act of reviewing your numbers weekly keeps you connected to your business. A simple weekly export from your POS into a consistent format gives you historical data you can analyse for patterns.
Analysing bar menu performance transforms how you run your venue. You move from guesswork to evidence-based decisions about what to stock, how to price, and how to train your team. Start with one metric this week. Track it consistently. Then add another. Within a month, you'll have the visibility to make decisions that improve your bottom line. Swallow Drinks has spent 40 years supporting independent bar operators, and we've seen firsthand how those who embrace data-driven menu management outperform their peers. Our team can help you think through your stock mix and ensure you're ordering the right products at the right pace.
Track sales volume (quantity sold per drink), revenue per item, cost of goods sold, and customer purchase frequency. Your POS system should record each transaction automatically. Additionally, monitor stock levels weekly to identify slow-moving items and fast sellers. This combination reveals which drinks drive profit versus which simply move volume. Real-time reporting helps you spot trends before they become problems.
Review your menu performance monthly for trends, but analyse key metrics weekly. Monthly reviews let you spot seasonal patterns and adjust pricing or positioning. Weekly checks on sales velocity and stock levels help you catch issues early, particularly with premium or perishable items. Quarterly deep-dives using menu engineering matrices help you make strategic decisions about which drinks to feature, promote, or remove from your bar.
Popularity measures how often a drink sells (sales volume), while profitability measures how much profit each sale generates (contribution margin). A popular drink might have low margins; a less popular drink might be highly profitable per serve. Menu engineering balances both by categorising drinks into stars (popular and profitable), plowhorses (popular but low margin), puzzles (unpopular but high margin), and dogs (unpopular and low margin). This helps you decide which drinks deserve prime positioning on your menu.
Menu engineering uses data on sales volume and profit margin to optimise your menu layout, pricing, and promotion strategy. By identifying which drinks are both popular and profitable (stars), you can feature them prominently and train staff to recommend them. You can raise prices on high-margin, low-volume items (puzzles) or bundle them with popular drinks. Removing low-profit items (dogs) frees up stock space and staff focus. This strategic approach typically increases overall profit margin without reducing customer satisfaction.
Members of:


AWRS Registration Number: XJAW00000100730