Aug 03, 2026
Last Updated: August 3, 2026
Understanding best practices for bar stock is essential for any UK hospitality business. At Swallow Drinks, we've worked with hundreds of independent bars and pubs across Birmingham and the West Midlands, and the difference between venues that control costs and those that haemorrhage profit often comes down to stock discipline. When stock isn't tracked properly, shrinkage creeps in, pour costs drift upward, and profit margins compress without anyone knowing why.
This guide covers the core strategies that separate profitable venues from those struggling with waste and variance: establishing consistent counting schedules, building spreadsheet systems that work, reducing shrinkage, implementing software that integrates with your POS, and organising your physical bar layout for efficiency.
How often you count stock determines how quickly you spot problems. Monthly counts are too infrequent to catch operational issues in real time. A high-volume nightclub losing £50 per night to unmeasured shrinkage costs £18,250 annually. The faster your turnover, the more frequently you should count.
Weekly counts take 90 minutes to 2 hours for a typical bar. Weekly counts let you spot trends: if spirits are down 2% one week and it happens three weeks in a row, you know there's a pattern of over-pouring, spillage, or theft. With monthly counts, you might not notice until the damage is £500.
For high-volume venues (nightclubs, busy pubs), weekly counting is standard. For craft bars with lower turnover, bi-weekly strikes the right balance. Monthly counts work only if you're also tracking usage through POS integration.
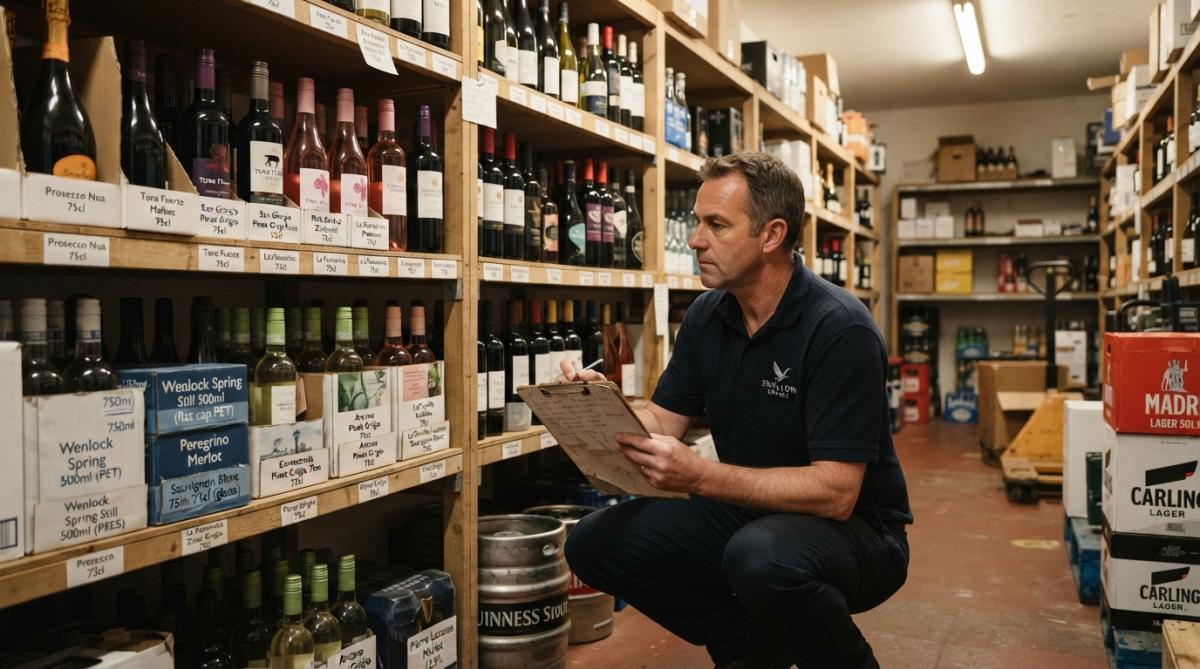
Count either early morning before service or late evening after close. Early morning (8-10am) works best: the bar is quiet, lighting is good, and you can resolve discrepancies before the day starts. Assign roles clearly: one person calls out, another records, a third verifies weights on scales.
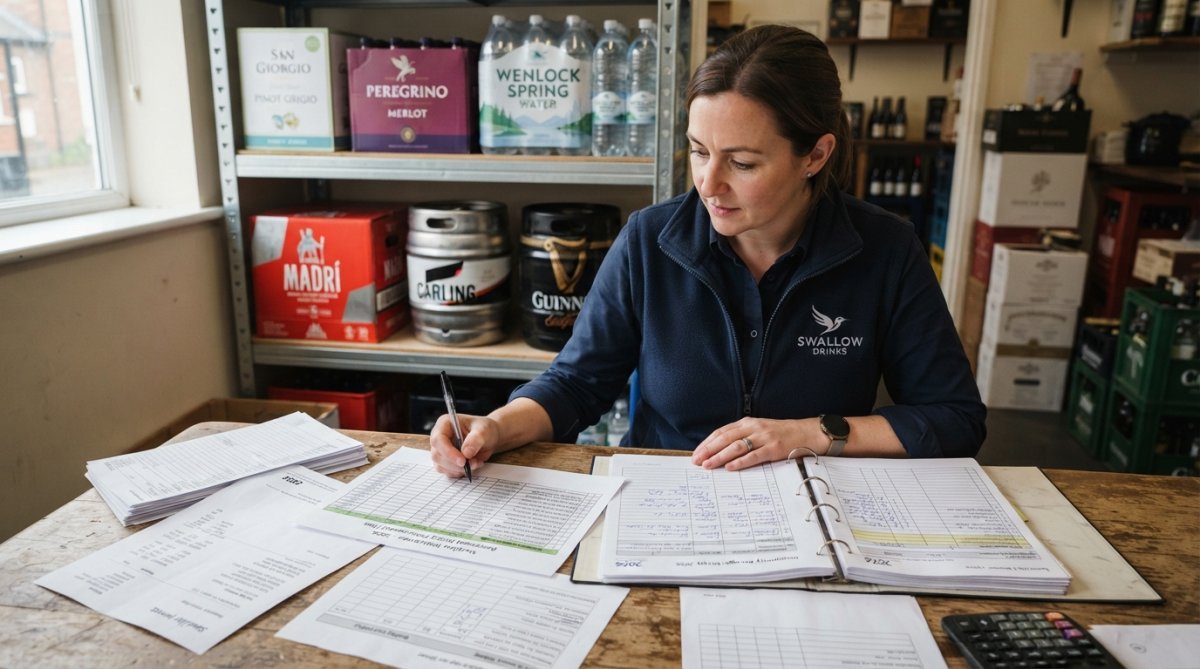
A spreadsheet is the foundation of bar stock control. It doesn't require software investment, it's transparent, and staff can understand it.
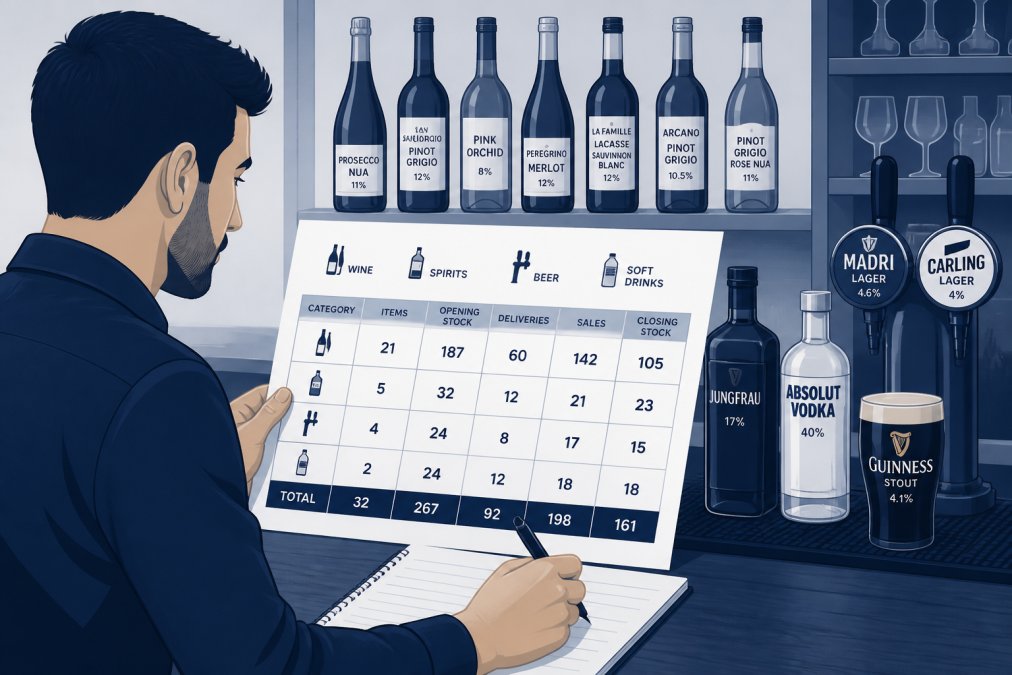
Your spreadsheet needs these columns:
| Column | Purpose | Example |
|---|---|---|
| Product Name | What you're counting | Tanqueray Gin 70cl |
| Par Level | Target stock quantity | 3 bottles |
| Previous Count | Last week's closing stock | 2.5 bottles |
| Opening Stock | This count's starting point | 2.5 bottles |
| Purchases | What you received from supplier | 2 bottles |
| Current Count | Physical stock today | 3.8 bottles |
| Usage | Opening + Purchases - Current | 0.7 bottles |
| Unit Cost | Cost per bottle from supplier | £18.50 |
| Usage Value | Usage × Unit Cost | £12.95 |
| Variance | Expected usage vs. actual | +0.3 bottles |
The variance column is where you catch problems. If your par level is 3 bottles and you expected to sell 0.5 bottles this week based on POS data, but you actually used 0.7, that's a variance worth investigating.
For spirits, measure in fractions using a bottle scale. For beer kegs, measure to 1/10th of a keg. For wine, measure by the glass or bottle depending on how you sell it.
Automate the maths using Excel or Google Sheets. Pour cost percentage = (Total Spirits Cost / Total Spirits Revenue) × 100. If your total spirits cost is £800 and your spirits revenue is £3,200, your pour cost is 25%. Industry standard for bars is 18-24%, so a 25% pour cost signals over-generous pours, spillage, or unrecorded sales.
Set up conditional formatting to highlight variances outside acceptable ranges. A variance of ±5% on any product is normal. Anything beyond that deserves investigation. Store this spreadsheet in a shared cloud location so multiple staff can access it and track trends month to month.
Shrinkage, the difference between what you should have and what you actually have, is the silent profit killer. Industry averages sit around 1-3% of COGS, but many independent venues run 4-6% without realising it. At a £10,000 monthly drinks spend, 4% shrinkage costs £400 per month, or £4,800 annually.
Shrinkage comes from five sources: over-pouring, spillage, breakage, theft, and unrecorded sales. Each requires a different control strategy.
Over-pouring is the biggest culprit. A standard spirit pour is 25ml. If your staff consistently pour 28ml, that's a 12% overage. Measure your actual pours regularly using a jigger or measuring glass.
Spillage happens during service and is largely unavoidable, but can be minimised with proper bar layout and training. Breakage should be tracked separately so you know it's a one-time loss, not systemic. Theft happens when a staff member pours free drinks for friends or a customer steals a bottle. Variance tracking catches this. If one shift consistently shows higher variance than others, you know where to focus.
If staff know their pours are measured and their shift's variance is tracked, they pour more carefully. Train all staff on standard pours before they work the bar. Show them what 25ml looks like and have them practice with a measuring glass until they're consistent. Spot-check weekly using a jigger.
Document training and keep a log showing which staff member was trained on which date. Create a culture where shrinkage is discussed openly. Share monthly variance reports with the team. Make it a team goal, not a management surveillance tool.
Spreadsheets work, but software scales better, integrates with your POS, and catches errors automatically. Most modern POS systems (Square, Toast, Lightspeed) have APIs that allow stock software to pull sales data automatically.
The real power of software is POS integration. When a drink is sold, your POS records it. Software can then compare what was sold (from POS) against what was used (from stock counts) to calculate actual variance.
Without POS integration, you're relying on manual counts and guesswork. With integration, the system knows exactly how many G&Ts were sold on Friday night, and when you count stock on Saturday morning, it can tell you whether the physical count matches expected usage.
Manual counting (spreadsheet + physical count) is labour-intensive but transparent and low-cost. Automated systems reduce labour, catch errors faster, and provide better reporting, but require upfront investment and staff training.
For venues under £500k annual turnover, a spreadsheet system with weekly counts usually works fine. For venues over £500k annual turnover, software ROI is clear. The labour savings alone pay for the software, and accuracy improvements reduce shrinkage by 0.5-1%.
How you arrange bottles behind the bar affects both efficiency and shrinkage.
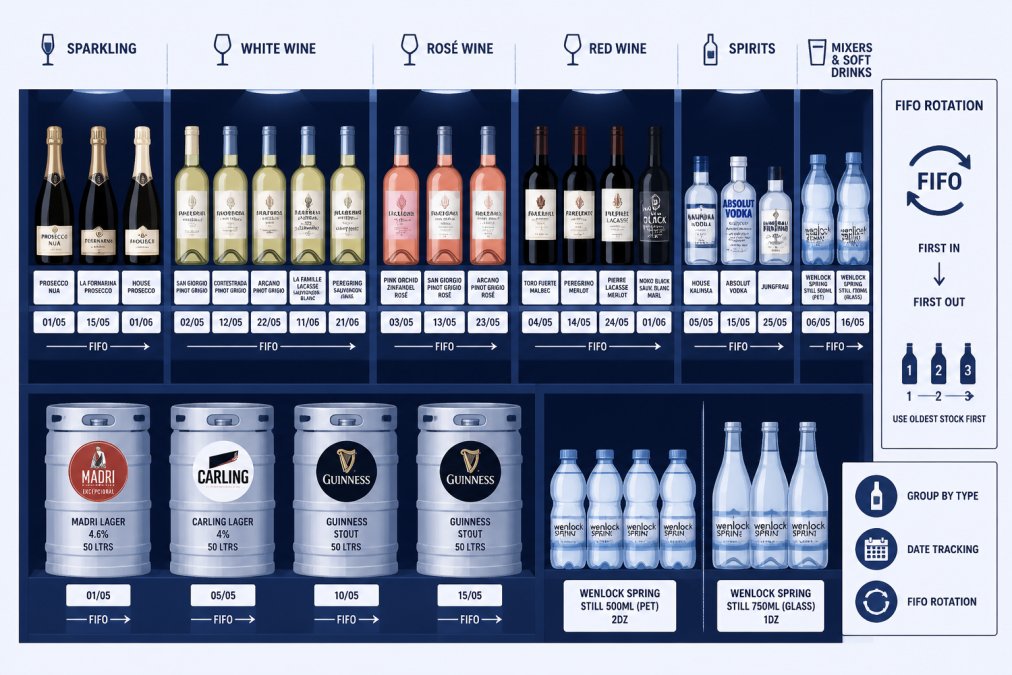
FIFO (First In, First Out) is the standard rotation method. New stock goes to the back, staff use from the front. This ensures older stock is used first, reducing the risk of bottles expiring or losing quality.
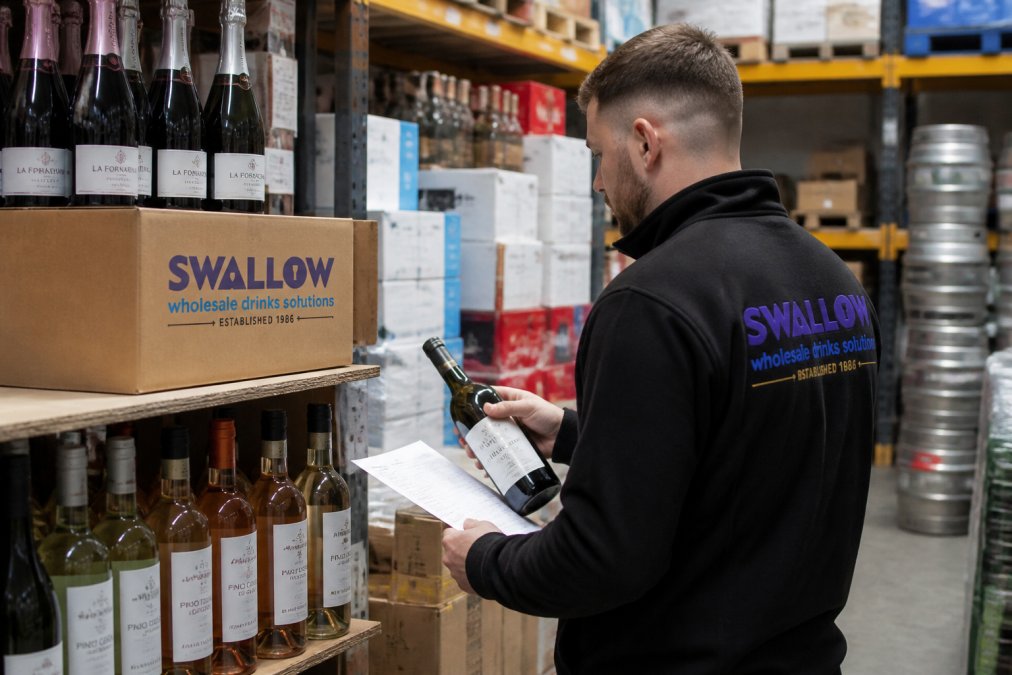
For spirits, FIFO is less critical because spirits don't expire quickly. But for wine, beer, and draught beer, FIFO prevents quality degradation. Implement FIFO by physically arranging stock. New deliveries go to the back. For draught beer, rotate kegs on a schedule and mark the changeover date on the keg.
Par level management keeps stock in the right range. Your par level is the quantity you want to have on hand at all times. Set par levels based on sales velocity and delivery frequency. If you sell 0.5 bottles per day and your supplier delivers twice weekly, par should be 4 bottles. Review par levels quarterly.
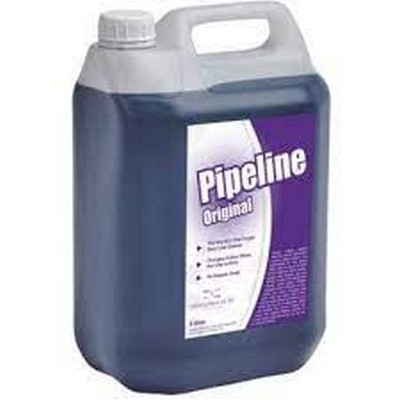
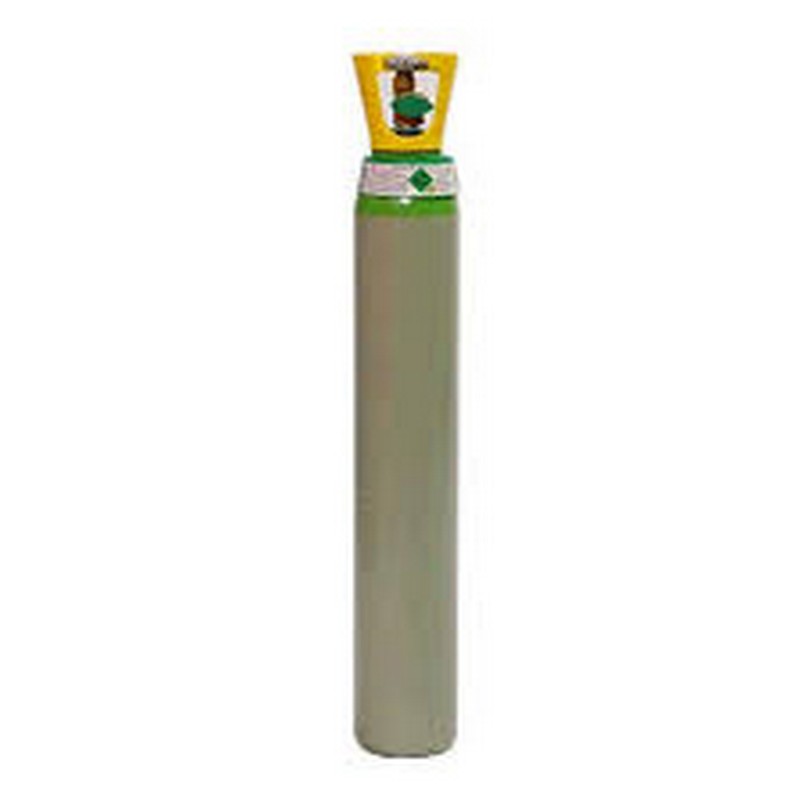
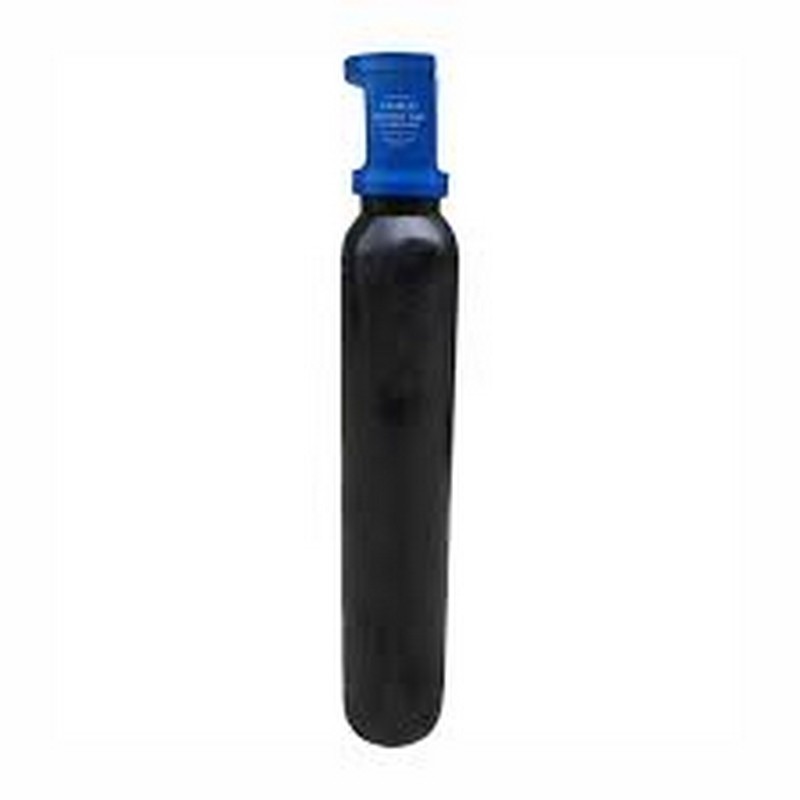
Swallow Drinks offers a range of bar supplies that support proper stock management. Our SWALLOW PURPLE B/LINE CLEANER 5LTR keeps draught lines clean and prevents quality issues that cause waste. For venues with mixed gas systems, our BOTTLE MIXED GAS 60/40 and BOTTLE C02 GAS ensure consistent pouring and reduce spillage from pressure issues.
A well-organised bar with proper par levels and FIFO rotation reduces the time staff spend searching for stock, minimises breakage, and makes counting faster and more accurate.
Pour cost is the percentage of revenue spent on spirits and drinks. It's the single most important metric for bar profitability. If your pour cost is 30% and industry standard is 22%, you're leaving 8% of revenue on the table.
Pour cost = (Total Drinks Cost / Total Drinks Revenue) × 100
Track this monthly. If it's trending upward, investigate. The culprit is usually over-pouring, price increases from suppliers, or menu pricing that's too low.
Alcohol cost percentage and pour cost are the same thing. A 20% alcohol cost means that for every £100 in drinks revenue, you spent £20 on the drinks themselves. The remaining £80 covers labour, rent, utilities, and profit.
Acceptable alcohol cost varies by venue type:
If your alcohol cost is above these ranges, you have a problem. Monitor alcohol cost weekly, not just monthly. If one week jumps from 22% to 26%, something changed. Weekly tracking lets you catch and fix issues quickly.
Variance is the difference between expected usage and actual usage. A variance of ±2% is normal. Anything beyond that needs investigation.
High-volume and craft venues have different stock challenges.
High-volume venues (nightclubs, busy pubs doing £20k+ per week in drinks) prioritise speed and consistency. Stock control focuses on shrinkage prevention because the absolute volume of loss is large. A 2% shrinkage at £20k weekly revenue is £400 per week, or £20,800 annually. Weekly counts are essential. Use measured pourers on bottles (optics that dispense exactly 25ml) and jiggers for cocktails to reduce the opportunity for over-pouring.
Staff accountability is high because shrinkage is visible. If Friday night consistently shows 3% variance and other nights show 1%, you know Friday's team has a problem. Draught beer management is critical. Kegs should be rotated every 7-10 days. Line cleaning should happen weekly. A dirty line reduces carbonation, increases foam, and leads to waste. Swallow Drinks supplies the SWALLOW PURPLE B/LINE CLEANER 5LTR for exactly this purpose.
Craft bars prioritise quality and consistency over speed. Stock control focuses on waste reduction and recipe costing. A £15 cocktail with £4 in spirits is a 27% pour cost. If your recipe uses 50ml of premium gin, you need to track that precisely. A 5ml over-pour per cocktail is a 10% cost increase.
Bi-weekly or monthly counts work for craft bars because transaction volume is lower. Recipe management is more important than in high-volume venues. You need to know the exact cost of each cocktail: spirits, mixers, garnish, ice. Track variance by recipe. If your Old Fashioned recipe has 8% variance but your Mojito has 2%, the difference is in preparation complexity and staff skill.
Document recipes precisely. Include measurements, ingredient specifications, and garnish requirements. Specialty ingredients (housemade bitters, infused spirits, craft mixers) should be tracked separately.
Swallow Drinks supports craft bars with a curated selection of premium spirits and niche labels. As a family-run independent wholesaler with over 40 years of experience, we understand the stock challenges craft venues face. Our consistent six-day-a-week delivery ensures you never run out of key ingredients. Register with WebTrade to access our full product range and place orders online.
Best practices for bar stock aren't complex, but they require discipline. The venues that control costs and maximise profit aren't the ones with the fanciest software, they're the ones that count regularly, track variance, and act on what the data tells them. Whether you're running a high-volume nightclub or a craft cocktail bar, the fundamentals are the same: establish a counting schedule, build a system that captures data, reduce shrinkage through staff accountability, and monitor pour cost relentlessly. Swallow Drinks has supported hundreds of independent venues across the West Midlands in building these systems. Get started with a weekly counting schedule this week, the difference in your bottom line will be visible within a month.
Most pubs benefit from weekly stock counts, though larger venues may do daily spot checks. Monthly full counts are the minimum for compliance and cost control. Weekly frequency catches discrepancies early, reduces shrinkage, and helps maintain accurate pour cost data. High-volume venues should count more frequently to track usage patterns and identify theft or over-pouring quickly.
Track three main loss points: spillage, over-pouring, and theft. Implement staff training on standard pour sizes, use bottle scales during counts, and establish clear par levels for each drink. Regular variance analysis reveals patterns. Many venues see 15-20% shrinkage reduction within three months by combining POS integration with staff accountability measures and proper FIFO rotation of stock.
Pour cost is the cost of goods sold divided by revenue from drinks sales, expressed as a percentage. Most bars target 20-30% pour cost. Calculate it by dividing total alcohol stock cost by total drink sales. Track variance monthly to spot pricing changes, waste, or staff issues. Accurate stock counts are essential for this calculation, making regular stock counts critical to profitability.
Include columns for item name, SKU, supplier, opening stock, purchases, closing stock, unit cost, total value, and variance. Add formulas to calculate usage (opening plus purchases minus closing) and variance percentage. Track par levels and reorder points. Many venues add columns for bottle scales readings and notes on discrepancies. A well-designed template saves hours during counts and provides clear variance reports for cost control.
Members of:


AWRS Registration Number: XJAW00000100730