Jul 12, 2026
Last Updated: July 12, 2026
Optimizing bar inventory is one of the most direct ways to improve profitability without increasing sales volume. Every pound of stock lost to waste, theft, or miscounting is profit lost. Venues that master stock control see margins improve by 8-15% within the first quarter alone.
The challenge isn't complexity, most bars already count stock. The problem is that counting and optimising are different things. A bar might know it has 47 bottles of vodka on Tuesday, but without understanding par levels, pour costs, and variance patterns, that number is just data. This guide covers how to establish par levels that match demand, calculate true drink costs, identify shrinkage, and set up systems that catch problems before they become expensive habits.
Proper bar stock management treats inventory as working capital. Every pound tied up in unused stock is a pound not earning revenue elsewhere. Venues that implement structured approaches, knowing what you should have (par levels), what you actually have (regular counts), and tracking the difference (variance), see shrinkage drop by 20-30% in the first month.
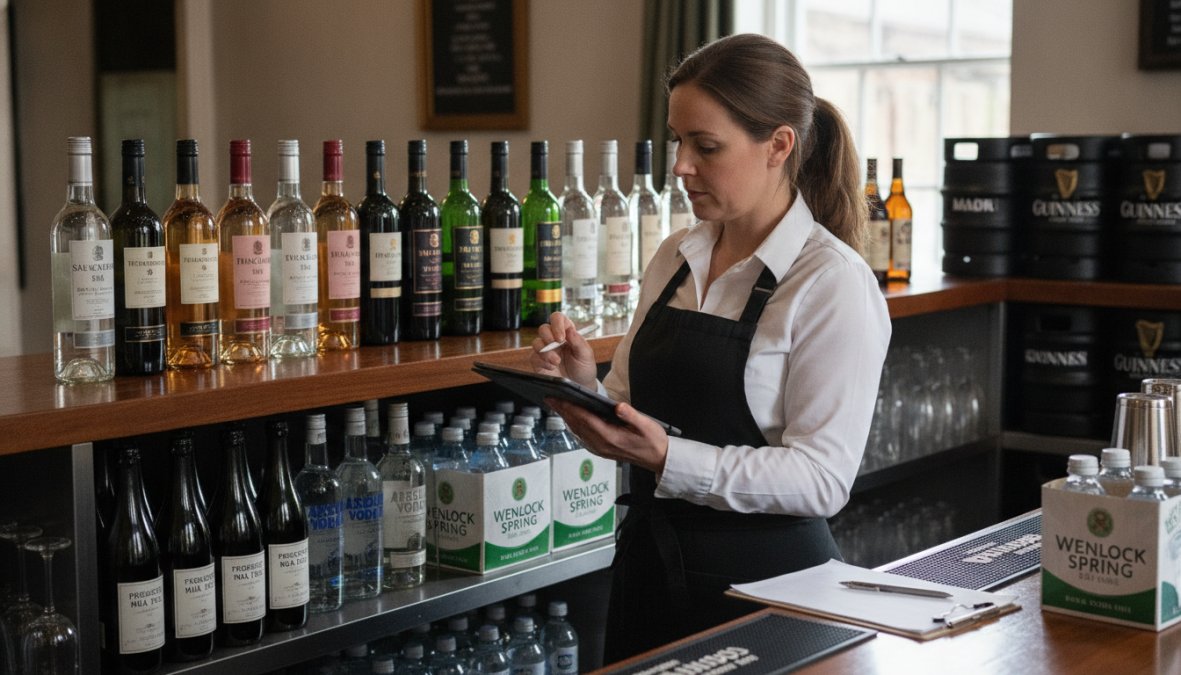
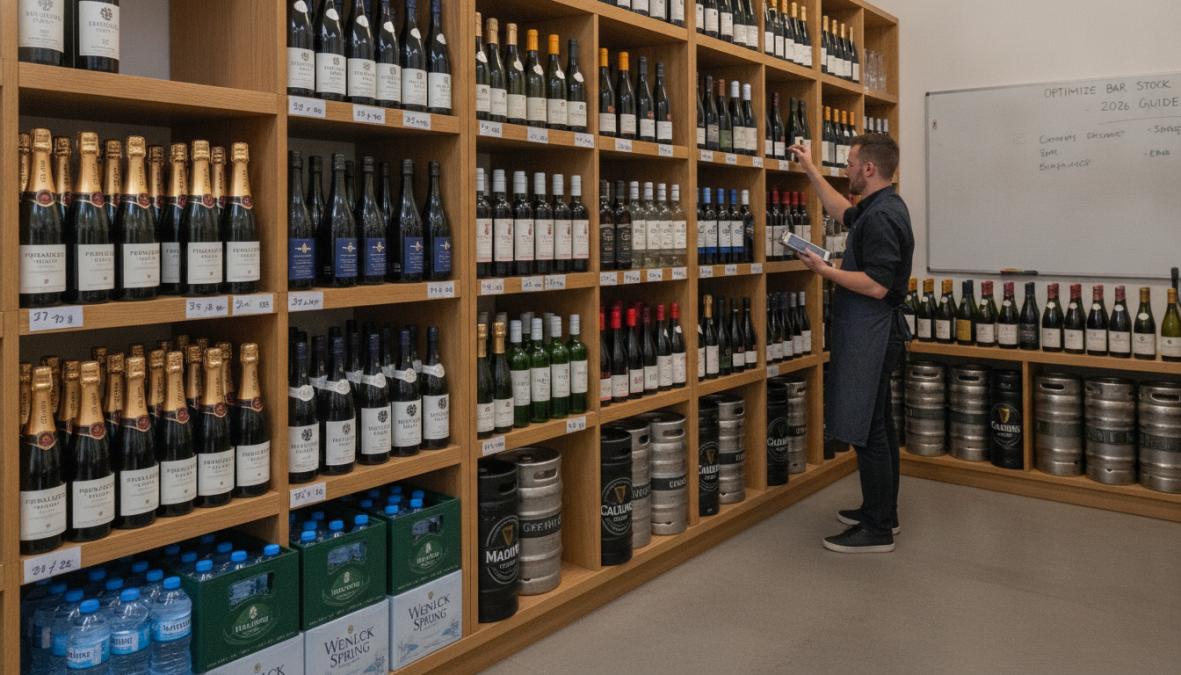
Par levels are the minimum quantity needed on hand to meet demand between deliveries without running short. Calculate par by multiplying average daily usage by days between deliveries, then add a safety buffer. If you sell 8 bottles of house vodka daily and your supplier delivers every 3 days, your par is roughly 24 bottles plus 3-4 extra.
Review par levels quarterly. A gin that sold 3 bottles weekly in January might sell 12 weekly by June if you've launched a popular cocktail featuring it. Once par levels are set, ordering becomes mechanical, place orders when stock drops to par, not when you feel like it. Consistency prevents panic orders and stockouts. Trade ordering platforms allow you to adjust quantities based on actual demand and place orders whenever it suits your schedule.
Counting accuracy determines whether you catch problems. Standardise when you count (weekly for most bars), who counts (the same person or trained rotation), and how they count (written process). Count bottles from back to front, record full bottles and opened bottles separately, and use consistent units of measure.
Record counts immediately in a spreadsheet or software, not from memory later. Digital records let you spot trends, if gin always seems short by 2 bottles on Fridays, you've found your problem.
Pour cost is the percentage of revenue spent on drinks. If a drink sells for £8 and costs £2 in stock, the pour cost is 25%. Calculate it by dividing cost of goods sold (COGS) by total drinks revenue. Most bars target 18-24%; anything above 28% signals a serious problem.
The power of pour cost is revealing patterns. If overall pour cost is 25% but spirits are 30% while wine is 20%, you've pinpointed where over-pouring happens. This granularity separates venues that control costs from those that accept them.
Liquor cost percentage is the cost of drinks specifically, excluding mixers and garnishes. Prime cost combines liquor cost with labour cost. If drinks cost 18% and labour is 28%, prime cost is 46%. Most venues target prime cost below 60-65%.
If prime cost is creeping up, investigate whether it's a drinks problem or labour problem. If liquor cost is stable but prime cost rises, you need to look at scheduling and efficiency, not stock.
Shrinkage is the difference between what stock records say you should have and what you actually have. A 5% shrinkage rate is normal; above 10% indicates a serious problem. Calculate monthly shrinkage by comparing opening stock plus purchases minus closing stock against what you sold.
Once you know your shrinkage rate, investigate where it happens. Is it specific products, specific staff, or specific times? The pattern tells you whether it's theft, waste, or poor controls.
Theft accounts for roughly 60-70% of bar shrinkage. The good news: it's preventable through visibility and accountability. Keep high-value spirits locked or behind the bar. Assign bottle responsibility, if a bartender opens a bottle, they're accountable for it. Use POS systems that log every drink sold, so you can compare what was rung up against what was poured.
Staff awareness matters enormously. When staff know stock is counted regularly and discrepancies are investigated, theft drops sharply. Consider security cameras focused on the bar itself, visible to staff. The presence of a camera is often enough to prevent casual theft.
Over-pouring is often unintentional but expensive. A bartender who pours 1.5 ounces when the recipe calls for 1 ounce costs roughly 50% extra. Across hundreds of drinks weekly, this becomes thousands of pounds annually.
Measure pours using jiggers, not free-pouring. For venues prioritising speed, consider pourers with built-in stops that dispense a set volume automatically. Track waste separately from shrinkage, broken bottles and spilled drinks are legitimate waste, not theft. Implement a spillage log so staff record incidents, accounting for the loss and revealing patterns.
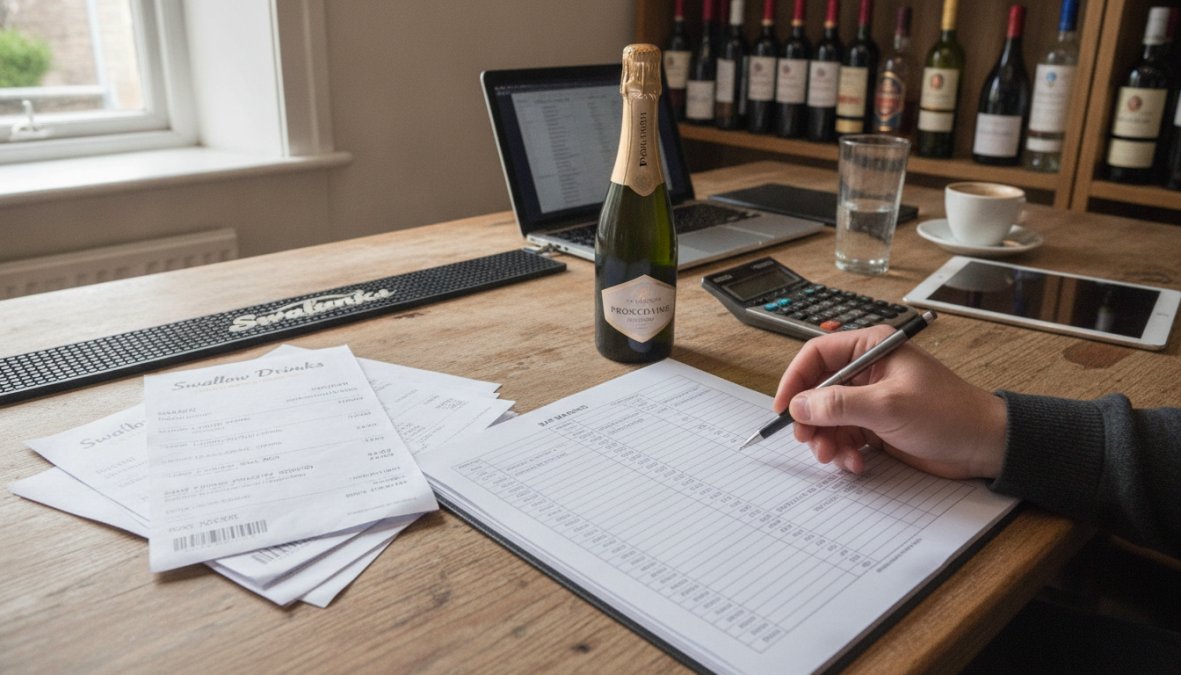
A spreadsheet is the minimum viable tool for stock management. It doesn't require software investment and works offline, but it demands discipline.
Your spreadsheet needs these columns: Item Name, Par Level, Opening Count, Purchases This Period, Closing Count, Expected Usage (Opening + Purchases - Par), Actual Usage (from POS), Variance (Expected - Actual), and Variance %.
If you opened with 20 vodka bottles, bought 10, and closed with 18, your expected usage is 20 + 10 - 18 = 12 bottles. If your POS shows 11 bottles sold, your variance is 1 bottle (8% variance). Small variances are normal; consistent variances point to a problem.
| Item | Par | Opening | Purchases | Closing | Expected Usage | Actual Usage | Variance | Variance % |
|---|---|---|---|---|---|---|---|---|
| House Vodka | 20 | 20 | 10 | 18 | 12 | 11 | 1 | 8% |
| Premium Gin | 8 | 7 | 5 | 6 | 6 | 6 | 0 | 0% |
| House Rum | 15 | 14 | 8 | 12 | 10 | 9 | 1 | 10% |
Update this weekly. Variance under 5% is excellent; 5-10% is acceptable; above 10% requires investigation. When you spot a high-variance item, drill down to identify whether it was a specific shift, bartender, or counting error.
A POS system that tracks every drink sold is invaluable for stock control. When a bartender rings up a drink, the POS logs it. At the end of the day, you can see exactly how many vodka sodas, gin and tonics, and house pours were sold. Compare this against your physical count, and any gap is shrinkage.
The best POS systems let you set par levels in the software. When stock drops below par, the system alerts you. Some integrate with suppliers, allowing you to place orders directly. For venues using suppliers with online ordering platforms, integrating your POS with ordering systems simplifies the process and ensures you never run short during service.
Stock control fails when staff don't understand why it matters. Training transforms staff from obstacles into partners in profitability.
Start with the "why." Show staff how shrinkage directly affects their wages. If shrinkage costs the venue £400 monthly, that's money not available for raises or bonuses. When staff see the connection, they become invested in control.
Train on the "how." Demonstrate proper pouring technique, explain why consistency matters, and show how to use a jigger. Walk through the counting process so everyone knows the standard. Having staff participate in the weekly count builds ownership.
Hold staff accountable without being punitive. If a bartender's shift consistently shows high variance, have a conversation about what's making it difficult. Most of the time, it's a fixable issue, not dishonesty.
The biggest barrier to stock control is that staff don't see how their actions affect the numbers. Address this by making the impact visible. After a week of careful pouring with jiggers, show staff the variance numbers. Seeing the difference is more persuasive than any lecture.
Create a culture of pride in stock control. Some venues celebrate low-shrinkage weeks with a small bonus or shout-out. When staff see that controlling shrinkage is valued, they engage.
Sustainability in bar operations increasingly means reducing waste and optimising resource use. This aligns with profit optimisation, less waste means lower costs.
Start with portion control. Standardised portions through jiggers reduce waste and keep costs predictable. Track expired stock separately. Use a first-in-first-out (FIFO) system so older stock is used before newer stock.
Consider concentrated syrups and cordials for high-volume drinks. House-made cordials cost less than pre-made mixers and reduce packaging waste. Gas management is often overlooked, leaking beer lines waste both product and gas. Maintain your lines regularly to keep them clean and prevent slow leaks.
Optimising bar stock is achievable through consistent execution of fundamentals: set par levels that match demand, count stock regularly using a standard process, calculate pour costs and variance to spot problems, implement controls that prevent theft and waste, train staff on the "why" and "how," and use technology to track and integrate data.
The venues that excel at this do it consistently. Weekly counts, regular variance reviews, and quarterly par adjustments catch problems before they become expensive. Staff who understand the impact of their actions pour consistently and protect stock because they see themselves as part of the solution.
Start with one improvement: this week, set par levels for your top 10 drinks. Next week, implement a consistent counting process. The month after, calculate your shrinkage rate. Small, consistent steps build a system that protects profit.
Working with a reliable supplier simplifies the process. Swallow Drinks has supported bars across Birmingham for over 40 years, offering premium stock and flexible ordering through Trade ordering that adapts to your stock levels.
According to research from the Drinks Trust hospitality sector analysis, venues that implement formal stock control systems see operational margins improve by an average of 12% within six months. For further guidance, the British Institute of Innkeeping training resources offers detailed frameworks for inventory control, and the Institute of Alcohol Studies research on hospitality operations provides evidence-based guidance on reducing shrinkage and improving profitability.
Most bars benefit from weekly stock counts, with a full inventory audit conducted monthly. High-volume establishments may audit weekly to catch discrepancies early. Regular audits help identify shrinkage trends, prevent theft, and ensure your par levels remain accurate. Consistency in timing (e.g., every Monday morning) makes the process easier for staff and improves data reliability for variance analysis.
Industry standard pour cost ranges from 20-30% of drink sales, though craft cocktail bars may run 25-35%. To calculate, divide total cost of goods sold (COGS) by total drinks revenue. For example, if you spent £500 on spirits and mixers and generated £2,000 in drinks sales, your pour cost is 25%. Track this monthly using a bar stock spreadsheet template to spot cost creep early and adjust recipes or pricing.
POS systems automatically record every drink sold, creating real-time data that you compare against physical stock counts. This integration reveals discrepancies instantly, if your system shows 20 bottles sold but your shelf-to-sheet count shows only 15 bottles missing, you've identified potential over-pouring or theft. POS integration also tracks recipe costing and helps enforce standardized portion sizes, directly reducing waste and loss.
The main culprits are over-pouring (inconsistent measures), spillage and waste, staff theft, and poor stock reconciliation practices. Over-pouring often stems from lack of training or accountability, staff may not use jiggers consistently. Psychological barriers, such as staff viewing free pours as a 'perk,' require clear communication about how shrinkage affects profitability. Implementing weighted average cost tracking and regular variance analysis helps pinpoint which issue is costing you the most.
Members of:


AWRS Registration Number: XJAW00000100730